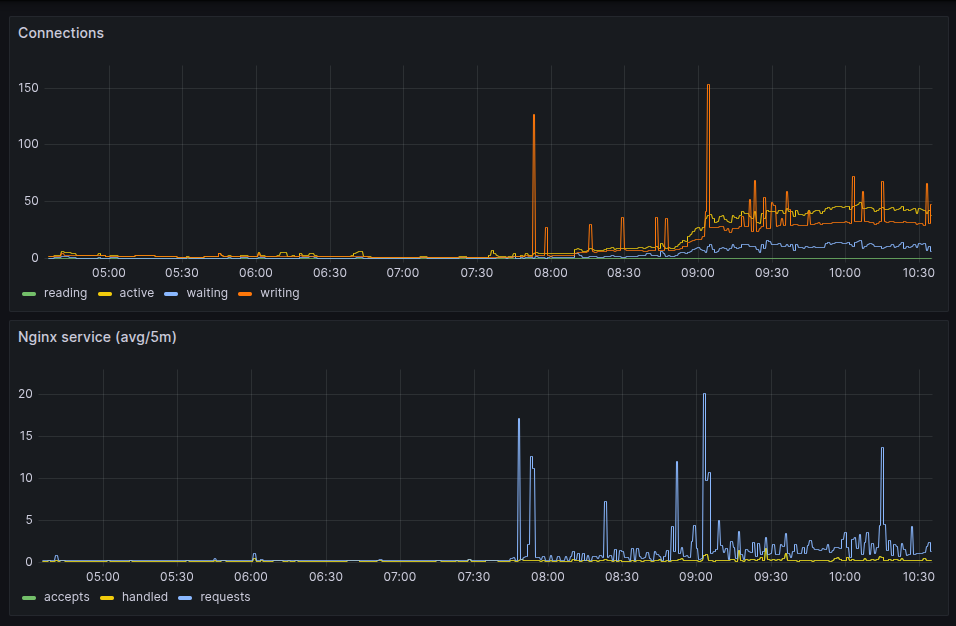
Seguindo o artigo expondo as métricas do nginx pro prometheus, aqui está o resultado olhado no grafana.
Como os valores
server_accepts_total,
server_handled_total e
server_requests_total
são do tipo counter,
eu usei um irate(__variável__[5m])
pra mostrar no gráfico da forma acima.
E como coletei esses dados? Eu já tinha comentado no artigo configurando o grafana alloy pra monitorar VMs que uso o alloy. Então foi adicionando uma entrada extra nele.
[...]
discovery.relabel "metrics_agent" {
        targets = array.concat(
                [{
                        __address__ = "localhost:9090",
                }],
        )

        rule {
                source_labels = ["__address__"]
                target_label  = "instance"
        }
}
[...]
prometheus.scrape "nginx_metrics" {
        targets    = discovery.relabel.metrics_agent.output
        forward_to = [prometheus.remote_write.prod.receiver]
}
Agora fica mais fácil entender o que acontece com as páginas servidas e se tem realmente alguma lentidão.