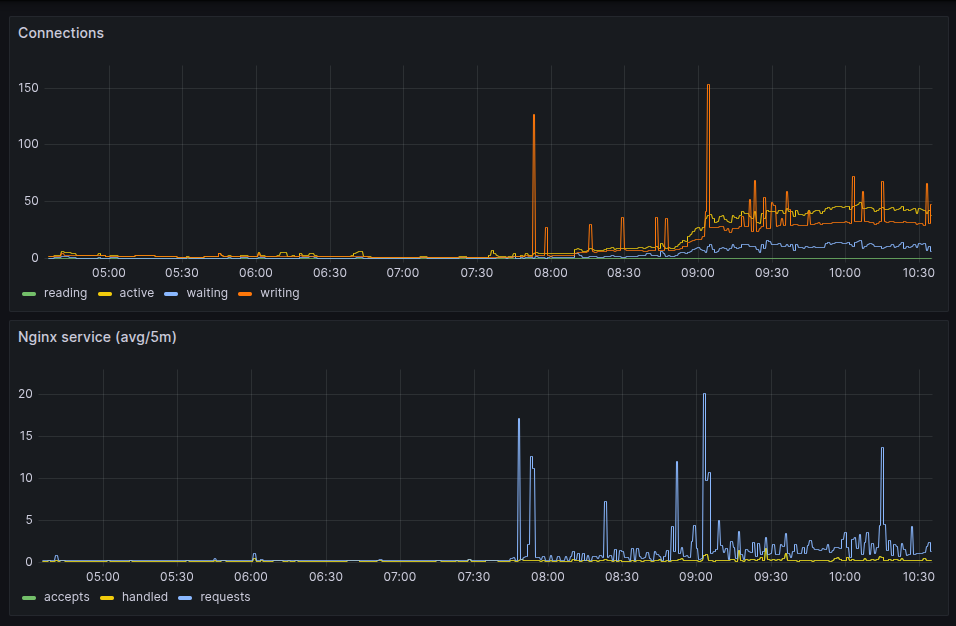
Seguindo o artigo expondo as métricas do nginx pro prometheus, aqui está o resultado olhado no grafana.
Como os valores
server_accepts_total,
server_handled_total e
server_requests_total
são do tipo counter,
eu usei um irate(__variável__[5m])
pra mostrar no gráfico da forma acima.
E como coletei esses dados? Eu já tinha comentado no artigo configurando o grafana alloy pra monitorar VMs que uso o alloy. Então foi adicionando uma entrada extra nele.
[...]
discovery.relabel "metrics_agent" {
        targets = array.concat(
                [{
                        __address__ = "localhost:9090",
                }],
        )

        rule {
                source_labels = ["__address__"]
                target_label  = "instance"
        }
}
[...]
prometheus.scrape "nginx_metrics" {
        targets    = discovery.relabel.metrics_agent.output
        forward_to = [prometheus.remote_write.prod.receiver]
}
Agora fica mais fácil entender o que acontece com as páginas servidas e se tem realmente alguma lentidão.

Confesso que pra escrever o script pra lers os logs do servidor web, aquele que mostrei em acessos de robôs nos logs web, foi algo próximo do vudu. Tudo porque o formato gerado não é lá muito amigável.
Idem pras máquinas do trabalho. Então hoje eu resolvi dar uma olhada se tinha como escrever esses mesmos logs em json.
E tem.
O primeiro que olhei foi no nginx. E é bem fácil de fazer.
log_format logger-json escape=json '{"source": "nginx", "time": "$time_iso8601", "resp_body_size": $body_bytes_sent, "host": "$http_host", "address": "$remote_addr", "request_length": $request_length, "method": "$request_method", "uri": "$request_uri", "status": $status,  "user_agent": "$http_user_agent", "resp_time": $request_time, "upstream_addr": "$upstream_addr"}';
[...]
server {
    listen 443 ssl;
    server_name api.company.com;
   ...

    access_log /var/log/nginx/access.log logger-json;
   ...
}
Eu segui a receita desses dois links aqui:
https://www.velebit.ai/blog/nginx-json-logging/
https://nginx.org/en/docs/http/ngx_http_log_module.html#log_format
Pro Apache não tem um módulo que já gera tudo meio mastigado como no nginx. Mas você pode criar o formato do log como quiser.
LogFormat "{ \"time\":\"%{%Y-%m-%d}tT%{%T}t.%{msec_frac}tZ\", \"process\":\"%D\", \"filename\":\"%f\", \"remoteIP\":\"%a\", \"host\":\"%V\", \"request\":\"%U\", \"query\":\"%q\", \"method\":\"%m\", \"status\":\"%>s\", \"userAgent\":\"%{User-agent}i\", \"referer\":\"%{Referer}i\" }" combined
ErrorLogFormat "{ \"time\":\"%{%Y-%m-%d}tT%{%T}t.%{msec_frac}tZ\", \"function\" : \"[%-m:%l]\" , \"process\" : \"[pid %P:tid %T]\" , \"message\" : \"%M\" ,\ \"referer\"\ : \"%{Referer}i\" }"
E esse veio de dica do stack-overflow:
Eu não segui os mesmos parâmetros entre apache e nginx. Por enquanto estou só testando e estar com os campos bem definidos já é o suficiente pra mim.
> tail -1 /var/log/apache2/linux-br-access.log | jq .
{
  "time": "2025-08-20T09:38:59.369Z",
  "process": "241797",
  "filename": "/var/www/linux-br.org/index.php",
  "remoteIP": "54.36.149.72",
  "host": "linux-br.org",
  "request": "/date/2024/03/page/3/",
  "query": "",
  "method": "GET",
  "status": "200",
  "userAgent": "Mozilla/5.0 (compatible; AhrefsBot/7.0; +http://ahrefs.com/robot/)",
  "referer": "-"
}
Agora ficou fácil de filtrar e pegar só os campos que interessam. E usando "jq".
> tail -1 /var/log/apache2/linux-br-access.log | jq ".userAgent"
"Mozilla/5.0 (compatible; AhrefsBot/7.0; +http://ahrefs.com/robot/)"
> tail -3 /var/log/apache2/linux-br-access.log | jq ".userAgent"
"Mozilla/5.0 (compatible; AhrefsBot/7.0; +http://ahrefs.com/robot/)"
"Mozilla/5.0 (compatible; SemrushBot/7~bl; +http://www.semrush.com/bot.html)"
"Mozilla/5.0 (compatible; AhrefsBot/7.0; +http://ahrefs.com/robot/)"

Esses dias eu peguei um problema no servidor web, nginx. Não nele especificamente. Mas um usuário estava reclamando que estava super lento pra carregar as páginas.
A questão então é como ver como e quanto está o nginx. Infelizmente a versão open source não fornece muita coisa. Só uma versão texto de estatísticas.
Não é grande coisa mas pelo menos já é ALGUMA COISA.
Agora como monitorar isso no Grafana?
A resposta são open metrics. E isso não tem.
Não tinha.
Fiz um programa em Go que converte essas estatísticas em open metrics e expõe na porta 9090 no endpoint /metrics.
Pra ter isso funcionando, é preciso primeiro subir a configuração de estatísticas no nginx.
server {
    listen 127.0.0.1:8080;
    location /api {
        stub_status;
        allow 127.0.0.1;
        deny all;
    }
}
Eu salvei no arquivo statistics.conf e coloquei em /etc/nginx/conf.d.
E bastou um reload pra ter funcionado.
❯ curl localhost:8080/api
Active connections: 2
server accepts handled requests
 21 21 322
Reading: 0 Writing: 1 Waiting: 1
Agora é rodar o programa e apontar pra esse endpoint.
❯ ./nginx-openmetrics/nginx-openmetrics --service=http://localhost:8080/api
[2025-08-22T14:11:45] (INFO): 🚚 fetching data from:http://localhost:8080/api
[2025-08-22T14:11:45] (INFO): 🎬 starting service at port:9090
E a porta fica exposta pras métricas serem coletadas pelo prometheus ou grafana alloy. Ou qualquer outro programa que faça scrape de dados no padrão open metrics.
❯ curl localhost:9090/metrics
# HELP active_connections The number of active connections
# TYPE active_connections gauge
active_connections 1
# HELP reading_connections The number of active reading connections
# TYPE reading_connections gauge
reading_connections 0
# HELP server_accepts_total The total number of server accepted connections
# TYPE server_accepts_total counter
server_accepts_total 22
# HELP server_handled_total The total number of server handled connections
# TYPE server_handled_total counter
server_handled_total 22
# HELP server_requests_total The total number of server requests
# TYPE server_requests_total counter
server_requests_total 333
# HELP waiting_connections The number of waiting connections
# TYPE waiting_connections gauge
waiting_connections 0
# HELP writing_connections The number of active writing connections
# TYPE writing_connections gauge
writing_connections 1
E fica exposto em todas as interfaces.
❯ netstat -nat | grep 9090 | grep -i listen
tcp6       0      0 :::9090                 :::*                    LISTEN
O programa faz o update dos dados a cada 15 segundos. Pra não sobrecarregar.
E ainda falta dar uma melhorada com a entrada como serviço do systemd. Devo fazer isso hoje.
Próximo passo será gerar um pacote debian dele pra instalar fácil.
Update: Fri Aug 22 04:23:45 PM CEST 2025
Tá lá o arquivo pro systemd.
E está funcionando no sistema que estou testando.
root@server:/# systemctl status nginx-openmetrics.service
● nginx-openmetrics.service - nginx open metrics service
     Loaded: loaded (/etc/systemd/system/nginx-openmetrics.service; enabled; vendor preset: enabled)
     Active: active (running) since Fri 2025-08-22 14:08:17 UTC; 16min ago
   Main PID: 314061 (nginx-openmetri)
      Tasks: 7 (limit: 19076)
     Memory: 4.0M
        CPU: 47ms
     CGroup: /system.slice/nginx-openmetrics.service
             └─314061 /usr/sbin/nginx-openmetrics --service=http://localhost:8080/api

Aug 22 14:08:17 internal systemd[1]: Started nginx open metrics service.
Aug 22 14:08:17 internal nginx-openmetrics[314061]: [2025-08-22T14:08:17.78433] (INFO): nginx-open-metrics-service (1.0-9)
Aug 22 14:08:17 internal nginx-openmetrics[314061]: [2025-08-22T14:08:17.78441] (INFO): 🚚 fetching data from:http://localhost:8080/api
Aug 22 14:08:17 internal nginx-openmetrics[314061]: [2025-08-22T14:08:17.78442] (INFO): 🎬 starting service at port:9090