Numa discussão no fediverso falamos sobre habilitar as métricas do GoToSo, também conhecido como GoToSocial. Fiz algumas mudanças e consegui expor essas métricas.
O compose.yaml do GoToSo:
services:
  gotosocial:
    image: docker.io/superseriousbusiness/gotosocial:latest
    container_name: gotosocial
    user: 1000:1000
    networks:
      - gotosocial
    environment:
      GTS_HOST: bolha.linux-br.org
      GTS_DB_TYPE: postgres
      GTS_CONFIG_PATH: /gotosocial/config.yaml
      [...]
      OTEL_METRICS_PRODUCERS: prometheus
      OTEL_METRICS_EXPORTER: prometheus
      OTEL_EXPORTER_PROMETHEUS_HOST: 0.0.0.0
      OTEL_EXPORTER_PROMETHEUS_PORT: 9090
      [...]
    ports:
      - "8080:8080"
      - "9090:9090"
    [...]
A config.yaml também do GoToSo:
[...]
media-emoji-local-max-size: 250KiB
media-emoji-remote-max-size: 250KiB
advanced-rate-limit-requests: 0
metrics-enabled: true
Uma vez que isso estava habilitado e o container reiniciado, foi só verificar a porta 9090.
❯ curl -s localhost:9090/metrics | head -10
# HELP go_config_gogc_percent Heap size target percentage configured by the user, otherwise 100.
# TYPE go_config_gogc_percent gauge
go_config_gogc_percent{otel_scope_name="go.opentelemetry.io/contrib/instrumentation/runtime",otel_scope_schema_url="",otel_scope_version="0.63.0"} 100
# HELP go_goroutine_count Count of live goroutines.
# TYPE go_goroutine_count gauge
go_goroutine_count{otel_scope_name="go.opentelemetry.io/contrib/instrumentation/runtime",otel_scope_schema_url="",otel_scope_version="0.63.0"} 167
# HELP go_memory_allocated_bytes_total Memory allocated to the heap by the application.
# TYPE go_memory_allocated_bytes_total counter
go_memory_allocated_bytes_total{otel_scope_name="go.opentelemetry.io/contrib/instrumentation/runtime",otel_scope_schema_url="",otel_scope_version="0.63.0"} 1.6433066284e+11
# HELP go_memory_allocations_total Count of allocations to the heap by the application.
Em seguida subi um container, também com podman, pra coletar esses dados. Junto com um prometheus-exporter pra coletar dados da máquina.
compose.yaml:
services:
  prometheus:
    image: quay.io/prometheus/prometheus
    container_name: prometheus
    environment:
      TZ: Europe/Stockholm
    ports:
      - "9000:9090"
    volumes:
      - data:/prometheus
      - ./prometheus.yml:/etc/prometheus/prometheus.yml:ro
    restart: unless-stopped
    extra_hosts:
      - localserver:192.168.1.2

volumes:
  data:
prometheus.yml:
global:
  scrape_interval: 15s
  evaluation_interval: 15s

scrape_configs:
  - job_name: "prometheus"
    static_configs:
      - targets:
        - "localhost:9090"
        labels:
          app: "prometheus"

  - job_name: "mimir"
    static_configs:
      - targets:
        - "localserver:9100"
        labels:
          app: "mimir"

  - job_name: "gotoso"
    static_configs:
      - targets:
        - "localserver:9090"
        labels:
          app: "gotoso"
Isso já faz subir e você pode olhar no target health.
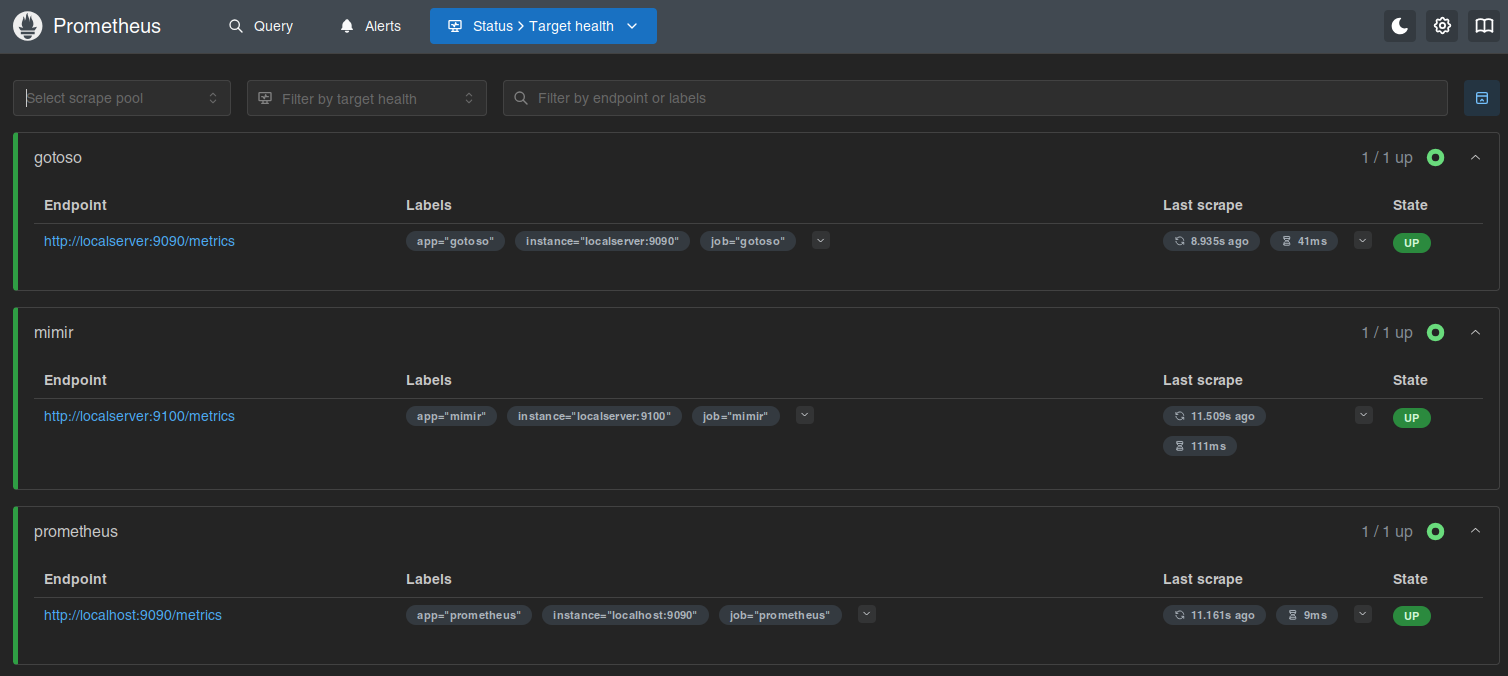
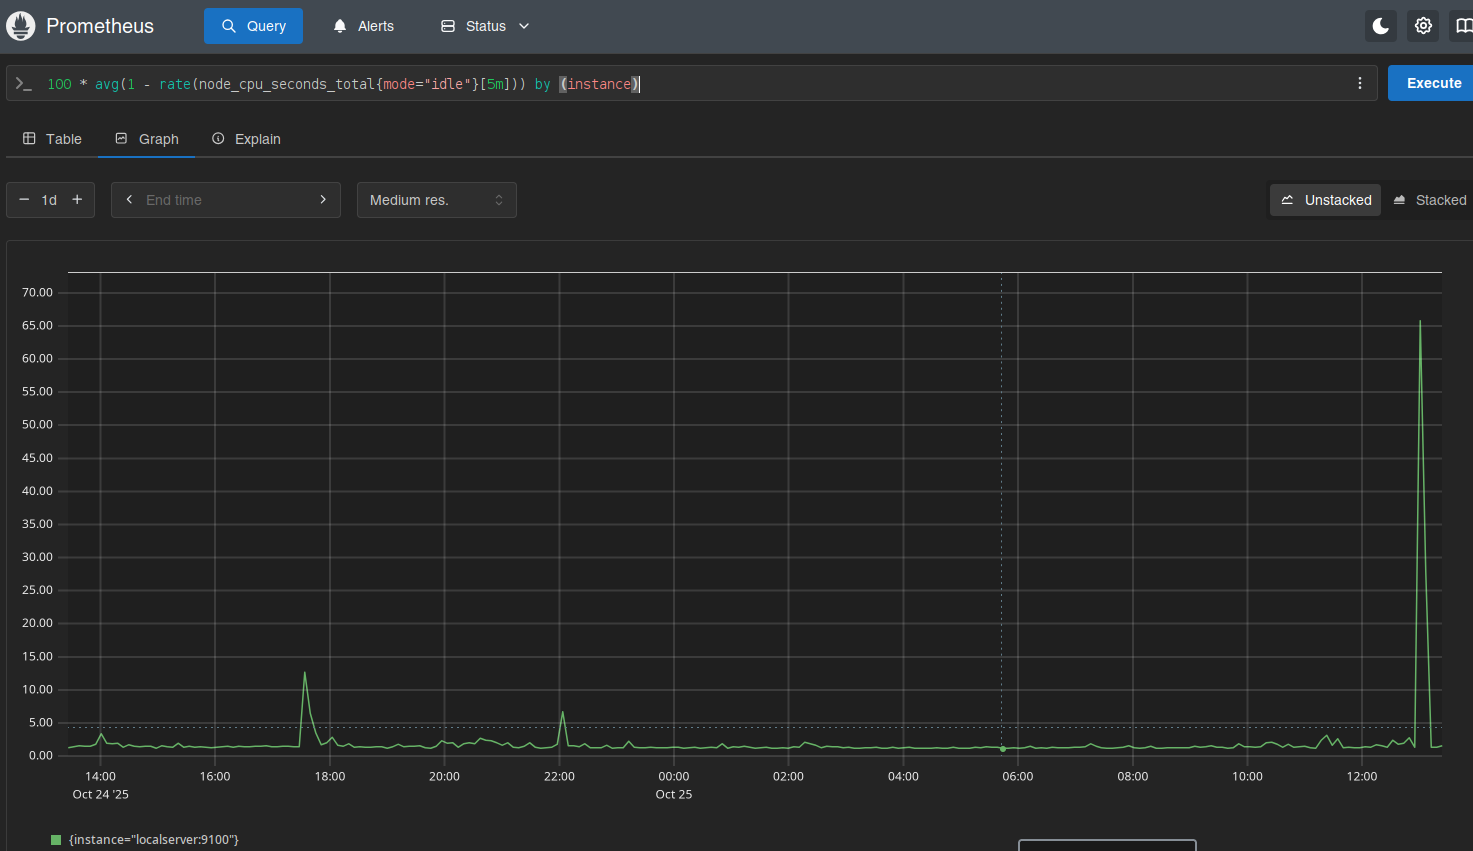
Daí é deixar o Prometheus coletar os dados e depois olhar os gráficos.

Ninguém me segurou, mas também não instalei o Grafana.
Por enquanto...
