
Esses dias eu peguei um problema no servidor web, nginx. Não nele especificamente. Mas um usuário estava reclamando que estava super lento pra carregar as páginas.
A questão então é como ver como e quanto está o nginx. Infelizmente a versão open source não fornece muita coisa. Só uma versão texto de estatísticas.
Não é grande coisa mas pelo menos já é ALGUMA COISA.
Agora como monitorar isso no Grafana?
A resposta são open metrics. E isso não tem.
Não tinha.
Fiz um programa em Go que converte essas estatísticas em open metrics e expõe na porta 9090 no endpoint /metrics.
Pra ter isso funcionando, é preciso primeiro subir a configuração de estatísticas no nginx.
server {
    listen 127.0.0.1:8080;
    location /api {
        stub_status;
        allow 127.0.0.1;
        deny all;
    }
}
Eu salvei no arquivo statistics.conf e coloquei em /etc/nginx/conf.d.
E bastou um reload pra ter funcionado.
❯ curl localhost:8080/api
Active connections: 2
server accepts handled requests
 21 21 322
Reading: 0 Writing: 1 Waiting: 1
Agora é rodar o programa e apontar pra esse endpoint.
❯ ./nginx-openmetrics/nginx-openmetrics --service=http://localhost:8080/api
[2025-08-22T14:11:45] (INFO): 🚚 fetching data from:http://localhost:8080/api
[2025-08-22T14:11:45] (INFO): 🎬 starting service at port:9090
E a porta fica exposta pras métricas serem coletadas pelo prometheus ou grafana alloy. Ou qualquer outro programa que faça scrape de dados no padrão open metrics.
❯ curl localhost:9090/metrics
# HELP active_connections The number of active connections
# TYPE active_connections gauge
active_connections 1
# HELP reading_connections The number of active reading connections
# TYPE reading_connections gauge
reading_connections 0
# HELP server_accepts_total The total number of server accepted connections
# TYPE server_accepts_total counter
server_accepts_total 22
# HELP server_handled_total The total number of server handled connections
# TYPE server_handled_total counter
server_handled_total 22
# HELP server_requests_total The total number of server requests
# TYPE server_requests_total counter
server_requests_total 333
# HELP waiting_connections The number of waiting connections
# TYPE waiting_connections gauge
waiting_connections 0
# HELP writing_connections The number of active writing connections
# TYPE writing_connections gauge
writing_connections 1
E fica exposto em todas as interfaces.
❯ netstat -nat | grep 9090 | grep -i listen
tcp6       0      0 :::9090                 :::*                    LISTEN
O programa faz o update dos dados a cada 15 segundos. Pra não sobrecarregar.
E ainda falta dar uma melhorada com a entrada como serviço do systemd. Devo fazer isso hoje.
Próximo passo será gerar um pacote debian dele pra instalar fácil.
Update: Fri Aug 22 04:23:45 PM CEST 2025
Tá lá o arquivo pro systemd.
E está funcionando no sistema que estou testando.
root@server:/# systemctl status nginx-openmetrics.service
● nginx-openmetrics.service - nginx open metrics service
     Loaded: loaded (/etc/systemd/system/nginx-openmetrics.service; enabled; vendor preset: enabled)
     Active: active (running) since Fri 2025-08-22 14:08:17 UTC; 16min ago
   Main PID: 314061 (nginx-openmetri)
      Tasks: 7 (limit: 19076)
     Memory: 4.0M
        CPU: 47ms
     CGroup: /system.slice/nginx-openmetrics.service
             └─314061 /usr/sbin/nginx-openmetrics --service=http://localhost:8080/api

Aug 22 14:08:17 internal systemd[1]: Started nginx open metrics service.
Aug 22 14:08:17 internal nginx-openmetrics[314061]: [2025-08-22T14:08:17.78433] (INFO): nginx-open-metrics-service (1.0-9)
Aug 22 14:08:17 internal nginx-openmetrics[314061]: [2025-08-22T14:08:17.78441] (INFO): 🚚 fetching data from:http://localhost:8080/api
Aug 22 14:08:17 internal nginx-openmetrics[314061]: [2025-08-22T14:08:17.78442] (INFO): 🎬 starting service at port:9090
Numa discussão no fediverso falamos sobre habilitar as métricas do GoToSo, também conhecido como GoToSocial. Fiz algumas mudanças e consegui expor essas métricas.
O compose.yaml do GoToSo:
services:
  gotosocial:
    image: docker.io/superseriousbusiness/gotosocial:latest
    container_name: gotosocial
    user: 1000:1000
    networks:
      - gotosocial
    environment:
      GTS_HOST: bolha.linux-br.org
      GTS_DB_TYPE: postgres
      GTS_CONFIG_PATH: /gotosocial/config.yaml
      [...]
      OTEL_METRICS_PRODUCERS: prometheus
      OTEL_METRICS_EXPORTER: prometheus
      OTEL_EXPORTER_PROMETHEUS_HOST: 0.0.0.0
      OTEL_EXPORTER_PROMETHEUS_PORT: 9090
      [...]
    ports:
      - "8080:8080"
      - "9090:9090"
    [...]
A config.yaml também do GoToSo:
[...]
media-emoji-local-max-size: 250KiB
media-emoji-remote-max-size: 250KiB
advanced-rate-limit-requests: 0
metrics-enabled: true
Uma vez que isso estava habilitado e o container reiniciado, foi só verificar a porta 9090.
❯ curl -s localhost:9090/metrics | head -10
# HELP go_config_gogc_percent Heap size target percentage configured by the user, otherwise 100.
# TYPE go_config_gogc_percent gauge
go_config_gogc_percent{otel_scope_name="go.opentelemetry.io/contrib/instrumentation/runtime",otel_scope_schema_url="",otel_scope_version="0.63.0"} 100
# HELP go_goroutine_count Count of live goroutines.
# TYPE go_goroutine_count gauge
go_goroutine_count{otel_scope_name="go.opentelemetry.io/contrib/instrumentation/runtime",otel_scope_schema_url="",otel_scope_version="0.63.0"} 167
# HELP go_memory_allocated_bytes_total Memory allocated to the heap by the application.
# TYPE go_memory_allocated_bytes_total counter
go_memory_allocated_bytes_total{otel_scope_name="go.opentelemetry.io/contrib/instrumentation/runtime",otel_scope_schema_url="",otel_scope_version="0.63.0"} 1.6433066284e+11
# HELP go_memory_allocations_total Count of allocations to the heap by the application.
Em seguida subi um container, também com podman, pra coletar esses dados. Junto com um prometheus-exporter pra coletar dados da máquina.
compose.yaml:
services:
  prometheus:
    image: quay.io/prometheus/prometheus
    container_name: prometheus
    environment:
      TZ: Europe/Stockholm
    ports:
      - "9000:9090"
    volumes:
      - data:/prometheus
      - ./prometheus.yml:/etc/prometheus/prometheus.yml:ro
    restart: unless-stopped
    extra_hosts:
      - localserver:192.168.1.2

volumes:
  data:
prometheus.yml:
global:
  scrape_interval: 15s
  evaluation_interval: 15s

scrape_configs:
  - job_name: "prometheus"
    static_configs:
      - targets:
        - "localhost:9090"
        labels:
          app: "prometheus"

  - job_name: "mimir"
    static_configs:
      - targets:
        - "localserver:9100"
        labels:
          app: "mimir"

  - job_name: "gotoso"
    static_configs:
      - targets:
        - "localserver:9090"
        labels:
          app: "gotoso"
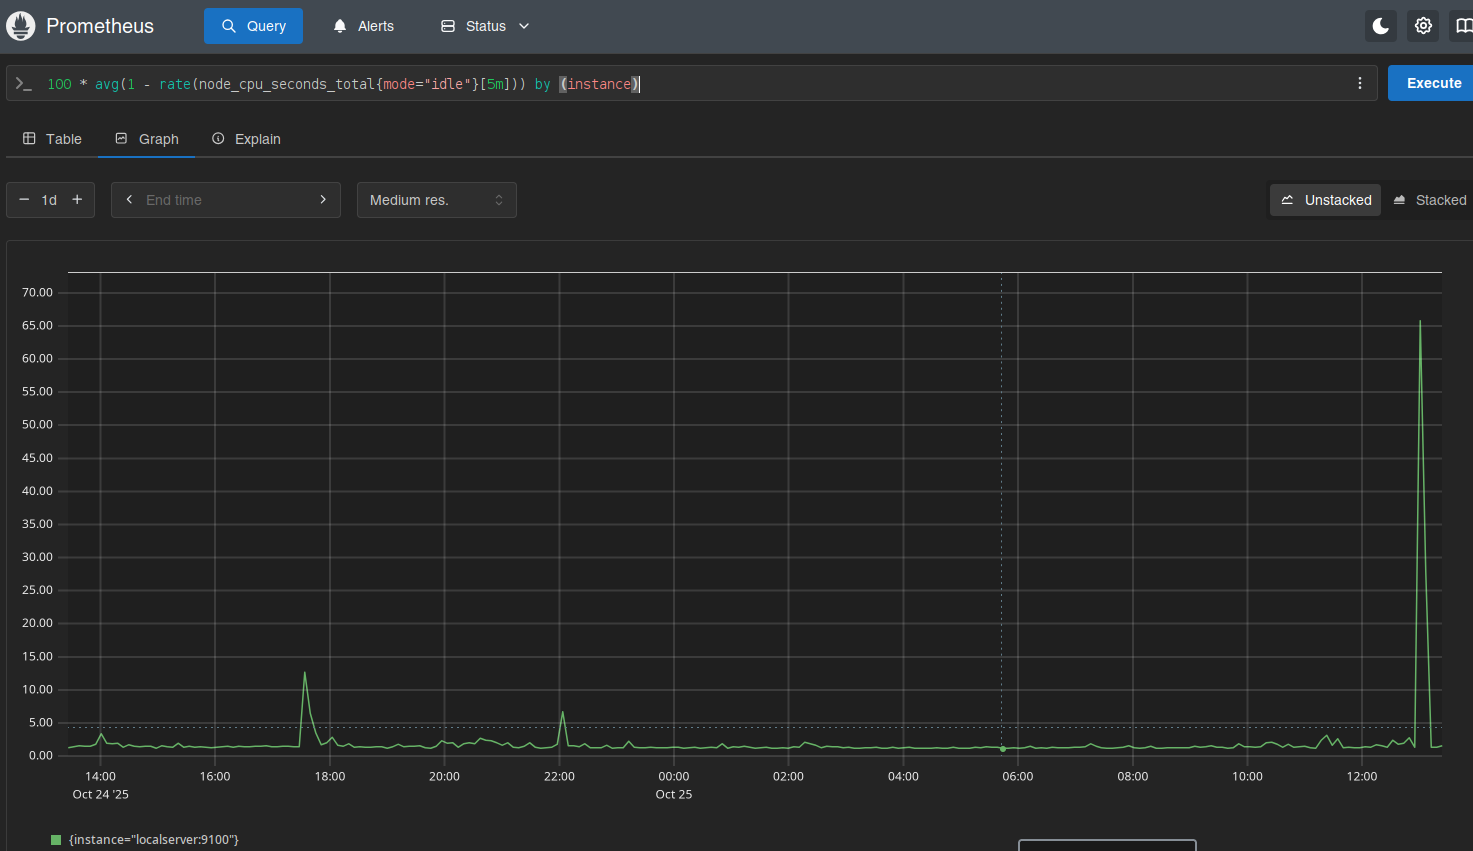
Isso já faz subir e você pode olhar no target health.
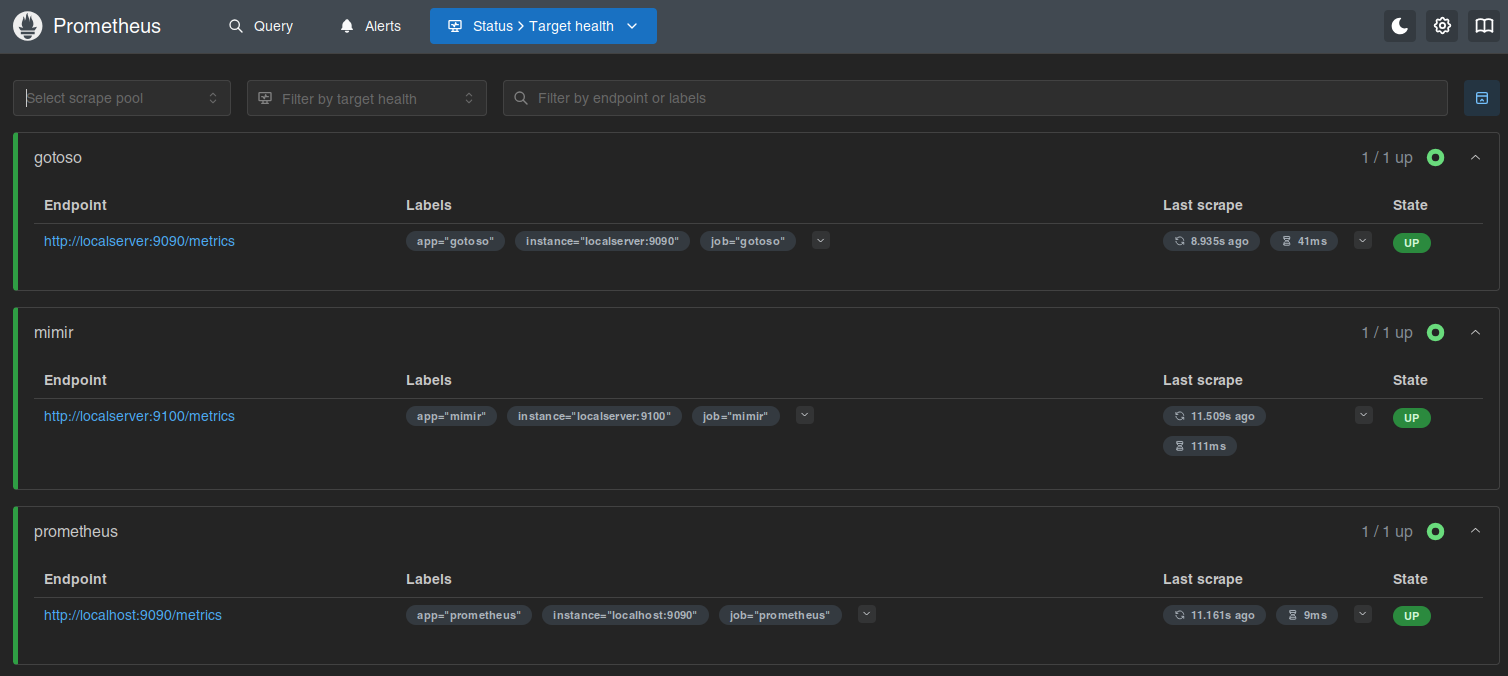
Daí é deixar o Prometheus coletar os dados e depois olhar os gráficos.

Ninguém me segurou, mas também não instalei o Grafana.
Por enquanto...
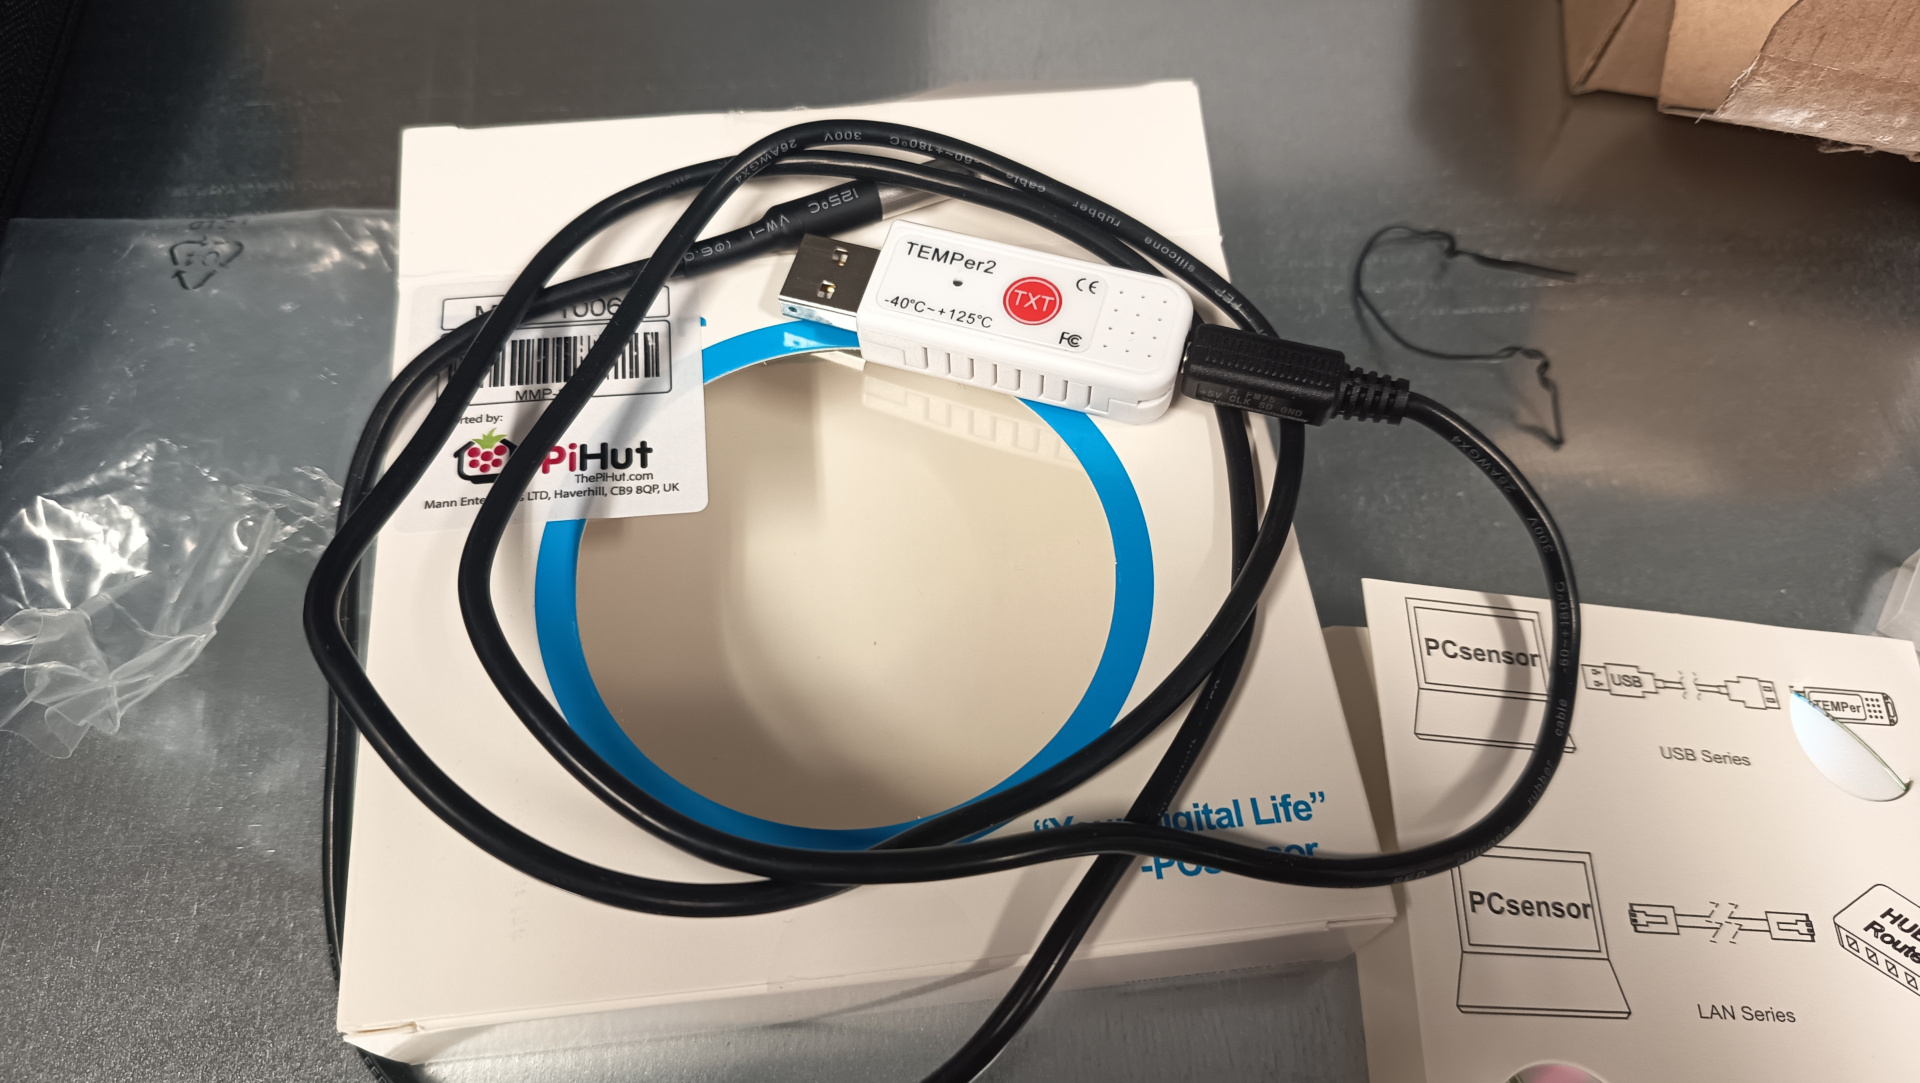
Eu descrevi o uso do sensor temper com raspberrypi no artigo
monitorando a temperatura da sala dos servidores.
O que eu não contei ali foi que eu passei a monitorar outros parâmetros mostrado pelo programa sensor.
O sensor faz parte do pacote lm-sensor no Ubuntu.
Rodando o programa com parâmetro -j mostra a saída em format JSON.
❯ sensors -j
{
   "coretemp-isa-0000":{
      "Adapter": "ISA adapter",
      "Package id 0":{
         "temp1_input": 61.000,
         "temp1_max": 100.000,
         "temp1_crit": 100.000,
         "temp1_crit_alarm": 0.000
      },
      "Core 0":{
         "temp2_input": 52.000,
         "temp2_max": 100.000,
         "temp2_crit": 100.000,
         "temp2_crit_alarm": 0.000
      },
      "Core 4":{
         "temp6_input": 54.000,
         "temp6_max": 100.000,
         "temp6_crit": 100.000,
         "temp6_crit_alarm": 0.000
      },
      "Core 8":{
         "temp10_input": 61.000,
         "temp10_max": 100.000,
         "temp10_crit": 100.000,
         "temp10_crit_alarm": 0.000
      },
      "Core 9":{
         "temp11_input": 61.000,
         "temp11_max": 100.000,
         "temp11_crit": 100.000,
         "temp11_crit_alarm": 0.000
      },
      "Core 10":{
         "temp12_input": 61.000,
         "temp12_max": 100.000,
         "temp12_crit": 100.000,
         "temp12_crit_alarm": 0.000
      },
      "Core 11":{
         "temp13_input": 61.000,
         "temp13_max": 100.000,
         "temp13_crit": 100.000,
         "temp13_crit_alarm": 0.000
      },
      "Core 12":{
         "temp14_input": 59.000,
         "temp14_max": 100.000,
         "temp14_crit": 100.000,
         "temp14_crit_alarm": 0.000
      },
      "Core 13":{
         "temp15_input": 59.000,
         "temp15_max": 100.000,
         "temp15_crit": 100.000,
         "temp15_crit_alarm": 0.000
      },
      "Core 14":{
         "temp16_input": 59.000,
         "temp16_max": 100.000,
         "temp16_crit": 100.000,
         "temp16_crit_alarm": 0.000
      },
      "Core 15":{
         "temp17_input": 60.000,
         "temp17_max": 100.000,
         "temp17_crit": 100.000,
         "temp17_crit_alarm": 0.000
      }
   },
   "thinkpad-isa-0000":{
      "Adapter": "ISA adapter",
      "fan1":{
         "fan1_input": 2191.000
      },
      "CPU":{
         "temp1_input": 59.000
      },
      "GPU":{
ERROR: Can't get value of subfeature temp2_input: Can't read

      },
      "temp3":{
         "temp3_input": 59.000
      },
      "temp4":{
         "temp4_input": 0.000
      },
      "temp5":{
         "temp5_input": 59.000
      },
      "temp6":{
         "temp6_input": 59.000
      },
      "temp7":{
         "temp7_input": 59.000
      },
      "temp8":{
ERROR: Can't get value of subfeature temp8_input: Can't read

      }
   },
   "ucsi_source_psy_USBC000:001-isa-0000":{
      "Adapter": "ISA adapter",
      "in0":{
         "in0_input": 0.000,
         "in0_min": 0.000,
         "in0_max": 0.000
      },
      "curr1":{
         "curr1_input": 0.000,
         "curr1_max": 0.000
      }
   },
   "BAT0-acpi-0":{
      "Adapter": "ACPI interface",
      "in0":{
         "in0_input": 12.909
      },
      "power1":{
         "power1_input": 0.000
      }
   },
   "iwlwifi_1-virtual-0":{
      "Adapter": "Virtual device",
      "temp1":{
         "temp1_input": 42.000
      }
   },
   "ucsi_source_psy_USBC000:002-isa-0000":{
      "Adapter": "ISA adapter",
      "in0":{
         "in0_input": 0.000,
         "in0_min": 0.000,
         "in0_max": 0.000
      },
      "curr1":{
         "curr1_input": 3.000,
         "curr1_max": 0.000
      }
   },
   "nvme-pci-0200":{
      "Adapter": "PCI adapter",
      "Composite":{
         "temp1_input": 44.850,
         "temp1_max": 85.850,
         "temp1_min": -273.150,
         "temp1_crit": 86.850,
         "temp1_alarm": 0.000
      },
      "Sensor 1":{
         "temp2_input": 47.850,
         "temp2_max": 65261.850,
         "temp2_min": -273.150
      },
      "Sensor 2":{
         "temp3_input": 44.850,
         "temp3_max": 65261.850,
         "temp3_min": -273.150
      }
   },
   "acpitz-acpi-0":{
      "Adapter": "ACPI interface",
      "temp1":{
         "temp1_input": 59.000
      }
   }
}
Essa saída de comando é do laptop de trabalho, onde estou escrevendo esse artigo.
É possível ver que aparecem alguns erros como ERROR: Can't get value of subfeature temp2_input: Can't read
e que alguns dados não tem valor como em { "coretemp-isa-0000":{ "Adapter": "ISA adapter" } }.
Quando fiz pro servidor, eu acabei meio que escrevendo o código na mão.
    sensors = shellExec("/usr/bin/sensors -j")
    logger.debug(f"sensors: {sensors}")
    jResp = json.loads(sensors)

    resp = list()
    resp.append("#HELP server_board_temperature_celsius the server board current temperatures")
    resp.append("#TYPE server_board_temperature_celsius gauge")
    device_1 = "nvme-pci-2b00"
    device_2 = "k10temp-pci-00c3"
    composite = jResp[device_1]["Composite"]["temp1_input"]
    logger.info(f"device: {device_1}, composite, temperature: {composite}")
    resp.append("server_board_temperature_celsius{device=\"" + device_1 + "\",sensor=\"composite\"} " + "%0.2f" % composite )
    sensor_1 = jResp[device_1]["Sensor 1"]["temp2_input"]
    resp.append("server_board_temperature_celsius{device=\"" + device_1 + "\",sensor=\"sensor_1\"} " + "%0.2f" % sensor_1 )
    sensor_2 = jResp[device_1]["Sensor 2"]["temp3_input"]
    resp.append("server_board_temperature_celsius{device=\"" + device_1 + "\",sensor=\"sensor_2\"} " + "%0.2f" % sensor_2 )
    tctl = jResp[device_2]["Tctl"]["temp1_input"]
    resp.append("server_board_temperature_celsius{device=\"" + device_2 + "\",sensor=\"tctl\"} " + "%0.2f" % tctl )
    tccd3 = jResp[device_2]["Tccd3"]["temp5_input"]
    resp.append("server_board_temperature_celsius{device=\"" + device_2 + "\",sensor=\"tccd3\"} " + "%0.2f" % tccd3 )
    tccd5 = jResp[device_2]["Tccd5"]["temp7_input"]
    resp.append("server_board_temperature_celsius{device=\"" + device_2 + "\",sensor=\"tccd5\"} " + "%0.2f" % tccd5 )
    resp.append("")
Então essa semana eu gastei um tempo pra fazer um script mais genérico.
Aparecem agora todos os dados que saem com valor no comando sensor -j, mas em contrapartida não sei exatamente o que são.
Sem mais delongas, aqui o código:
#! /usr/bin/env -S uv run --script
#
# /// script
# dependencies = [
#    "uvicorn",
#    "fastapi"
# ]
# ///

import argparse
import sys
import subprocess
import logging
import json
import re

from fastapi import FastAPI
from fastapi.responses import PlainTextResponse
import uvicorn


DEFAULTS = {"port": 9090, "path": "/metrics"}
__version__ = "0.1.0"

logger = logging.getLogger(__file__)
consoleOutputHandler = logging.StreamHandler()
formatter = logging.Formatter(
    fmt="[%(asctime)s] (%(levelname)s) %(message)s", datefmt="%Y-%m-%d %H:%M:%S"
)
consoleOutputHandler.setFormatter(formatter)
logger.addHandler(consoleOutputHandler)
logger.setLevel(logging.INFO)


def shellExec(command: str) -> str:
    "run a command and return its output"
    try:
        # result = subprocess.getoutput(command, errors=subprocess.DEVNULL)
        result = subprocess.check_output(
            command, stderr=subprocess.DEVNULL, encoding="utf-8"
        )
        logger.debug(f"shellExec: {result}")
        return result
    except Exception as e:
        logger.error(f"Error executing shell command '{command}': {e}")
        return f"Error: {e}"


class SensorMetrics:
    open_metrics: dict = {}

    def generateMetrics(self) -> list:
        self.dataReset()
        sensors_output = shellExec(["sensors", "-j"])
        logger.debug(f"sensors: {sensors_output}")
        sensorsJSON = json.loads(sensors_output)
        # sensorsJSON = {
        #     "thinkpad-isa-0000": {
        #         "Adapter": "ISA adapter",
        #         "fan1": {"fan1_input": 2786.000},
        #         "CPU": {"temp1_input": 69.000},
        #         "GPU": {},
        #         "temp3": {"temp3_input": 69.000},
        #         "temp4": {"temp4_input": 0.000},
        #         "temp5": {"temp5_input": 69.000},
        #         "temp6": {"temp6_input": 69.000},
        #         "temp7": {"temp7_input": 69.000},
        #         "temp8": {},
        #     }
        # }
        self.getOpenMetrics([], sensorsJSON)

        return []

    def dataReset(self):
        self.open_metrics = {}

    def getOpenMetrics(self, header: list, data_dict: dict):
        if isinstance(data_dict, dict):
            for k, v in data_dict.items():
                logger.debug(f"k={k}, v={v}")
                if isinstance(v, dict):
                    self.getOpenMetrics(header + [k], v)
                else:
                    logger.debug(
                        f"Value is not dictionary: header={header}, k={k}, v={v}"
                    )
                    try:
                        v = float(v)
                    except ValueError:
                        logger.debug(f"invalid value: {v}")
                        continue
                    metric_head = self.generateMetricHeader(header, k)
                    metric_description = " ".join(header)
                    metric_description += f" {k}"

                    if metric_head in self.open_metrics:
                        logger.error(f"metric name '{metric_head}' already exists")

                    self.open_metrics[metric_head] = {
                        "value": v,
                        "description": metric_description,
                    }
                    logger.debug(
                        f"Adding: metric_head={metric_head}, value={v}, description='{metric_description}'"
                    )
        else:
            logger.debug(f"Not dictionary: header={header}, data_dict={data_dict}")

    def generateMetricHeader(self, header: list, key: str) -> str:
        metric_header = "_".join(header)
        metric_header = re.sub(" ", "_", metric_header)
        return f"{metric_header}_{key}"


if __name__ == "__main__":
    parse = argparse.ArgumentParser(
        description="Script to expose the sensors as open metrics"
    )
    parse.add_argument(
        "--port", type=int, default=DEFAULTS["port"], help="Port to listen"
    )
    parse.add_argument(
        "--path", default=DEFAULTS["path"], help="The path to serve the metrics"
    )

    parse.add_argument(
        "--version",
        action=argparse.BooleanOptionalAction,
        help="Print version and exit",
    )
    parse.add_argument(
        "--printout",
        action=argparse.BooleanOptionalAction,
        help="Print the exposed metrics found in the system",
    )

    parse.add_argument("--loglevel", default="info", help="Logging level")

    args = parse.parse_args()

    if args.loglevel != "info":
        logger.setLevel(args.loglevel.upper())

    if args.version is True:
        print(sys.argv[0], __version__)
        sys.exit(0)

    if args.printout is True:
        mts = SensorMetrics()
        mts.generateMetrics()
        for k, v in mts.open_metrics.items():
            description = v["description"]
            print(f"#HELP {k} {description}")
            print(f"#TYPE {k} gauge")
            print(f"{k}: {v['value']}")
        sys.exit(0)

    app = FastAPI()

    @app.get(args.path, response_class=PlainTextResponse)
    async def metrics():
        logger.info(f"serving web page on {args.path}")
        mts = SensorMetrics()
        mts.generateMetrics()
        resp = list()
        for k, v in mts.open_metrics.items():
            description = v["description"]
            resp.append(f"#HELP {k} {description}")
            resp.append(f"#TYPE {k} gauge")
            resp.append(f"{k}: {v['value']}")
        return "\n".join(resp)

    logger.info(f"starting service on port {args.port}")
    uvicorn.run(app, host="127.0.0.1", port=args.port)
O código pode ser encontrado aqui:
Como pode ser visto no cabeçalho:
#! /usr/bin/env -S uv run --script
#
# /// script
# dependencies = [
#    "uvicorn",
#    "fastapi"
# ]
# ///
abracei com força a dica do querido Riverfount, que mostrou que o uv podia fazer isso.
E passei a adotar o pacote logging ao invés de enviar prints pro terminal.
logger = logging.getLogger(__file__)
consoleOutputHandler = logging.StreamHandler()
formatter = logging.Formatter(
    fmt="[%(asctime)s] (%(levelname)s) %(message)s", datefmt="%Y-%m-%d %H:%M:%S"
)
consoleOutputHandler.setFormatter(formatter)
logger.addHandler(consoleOutputHandler)
logger.setLevel(logging.INFO)
Eu sempre amarro esse singleton de logging, logger, com função do argparse pra poder modificar
o nível.
Começo sempre com info, mas usando o parâmetro --loglevel=debug eu mudo pro nível debug.
Torna prático e flexível pra gerenciar logs de funcionamento.
Além disso o logging usa STDERR pra enviar as mensagens.
Olhando agora pra parte de execução do script shell, onde sensors -j é chamado:
def shellExec(command: str) -> str:
    "run a command and return its output"
    try:
        # result = subprocess.getoutput(command, errors=subprocess.DEVNULL)
        result = subprocess.check_output(
            command, stderr=subprocess.DEVNULL, encoding="utf-8"
        )
        logger.debug(f"shellExec: {result}")
        return result
    except Exception as e:
        logger.error(f"Error executing shell command '{command}': {e}")
        return f"Error: {e}"
Uso como função ao invés de método da classe. Acho que fica mais simples. E poder rodar script do shell dentro de uma classe não parece lá muito como uma propriedade da classe em si.
Notem que inicialmente eu tentei usar subprocess.getoutput( ).
O problema são aquelas mensagens de erros que eu comentei acima,
ERROR: Can't get value of subfeature temp2_input: Can't read,
que saem junto.
Isso quebra a chamada do json.loads( ).
Tentei usar o parâmetro errors=subprocess.DEVNULL, mas aparentemente o subprocess.getoutput( ) não herda isso.
Então não funciona.
O jeito foi usar subprocess.check_output( ).
A grande diferença é que o primeiro aceita string, então poderia usar simplemente "sensors -j" como argumento.
No subprocess.check_output( ), o parâmetro precisa ser uma lista.
Tem de ser passado como ["sensors", "-j"] que não é o fim do mundo, só um pouco mais chato.
A classe SensorMetrics está bem simples de entender no começo.
Acho que a única parte que precisa de um pouco mais de cuidado pra olhar é o método getOpenMetrics( ).
    def getOpenMetrics(self, header: list, data_dict: dict):
        if isinstance(data_dict, dict):
            for k, v in data_dict.items():
                logger.debug(f"k={k}, v={v}")
                if isinstance(v, dict):
                    self.getOpenMetrics(header + [k], v)
                else:
                    logger.debug(
                        f"Value is not dictionary: header={header}, k={k}, v={v}"
                    )
                    try:
                        v = float(v)
                    except ValueError:
                        logger.debug(f"invalid value: {v}")
                        continue
                    metric_head = self.generateMetricHeader(header, k)
                    metric_description = " ".join(header)
                    metric_description += f" {k}"

                    if metric_head in self.open_metrics:
                        logger.error(f"metric name '{metric_head}' already exists")

                    self.open_metrics[metric_head] = {
                        "value": v,
                        "description": metric_description,
                    }
                    logger.debug(
                        f"Adding: metric_head={metric_head}, value={v}, description='{metric_description}'"
                    )
        else:
            logger.debug(f"Not dictionary: header={header}, data_dict={data_dict}")
Esse é um método recursivo. Olhando pra uma estrutura como essa aqui:
{
   "coretemp-isa-0000":{
      "Package id 0":{
         "temp1_input": 61.000,
         "temp1_max": 100.000,
         "temp1_crit": 100.000,
         "temp1_crit_alarm": 0.000
      }
    }
}
O loop quebra o dicionário recebido em k, v, ou "key" e "value".
Na primeira vez que recebe, os dados ficam assim:
{"Package id 0":{"temp1_input": 61.000,"temp1_max": 100.000,"temp1_crit": 100.000,"temp1_crit_alarm": 0.000 }}
Então ele se chama de novo, mas passa no parâmetro header a primeira chave que encontrou: coretemp-isa-0000.
{"temp1_input": 61.000,"temp1_max": 100.000,"temp1_max": 100.000,"temp1_crit_alarm": 0.000 }
Como value ainda é um dictionário, testando com isinstance( ), então ele
adiciona a chave Package id 0 na lista de headers e roda mais uma vez:
Como é um for-loop, ele pega essas chaves e valores.
Daí como tem o histórico do que veio antes dentro de header, fica fácil montar a estrutura.
Basta juntar tudo com "_" como separador.
    def generateMetricHeader(self, header: list, key: str) -> str:
        metric_header = "_".join(header)
        metric_header = re.sub(" ", "_", metric_header)
        return f"{metric_header}_{key}"
E é isso que é feito no método generateMetricHeader( ).
Espero que agora tenha ficado um pouco mais claro o que foi que eu fiz nesse programa. E o porquê de não saber se o valor é temperatura em Celsius ou o que seja, uma vez que esse dado não existe na estrutura em JSON gerada. Ou se é tensão em Volts. Fica tudo no mesmo balaio.
Nota: a manpage do sensors descreve que toda temperatura é por padrão em °C pra temperatura.
E também descreve que eu deveria estar usando o parâmetro "-J", que sai no formato que preciso.
Isso fica pra versão 0.2.0 do script 😊.
Rodando simplemente pelo shell, temos a seguinte saída (que pode mudar de acordo com seu hardware):
❯ sensors
coretemp-isa-0000
Adapter: ISA adapter
Package id 0:  +61.0°C  (high = +100.0°C, crit = +100.0°C)
Core 0:        +53.0°C  (high = +100.0°C, crit = +100.0°C)
Core 4:        +57.0°C  (high = +100.0°C, crit = +100.0°C)
Core 8:        +61.0°C  (high = +100.0°C, crit = +100.0°C)
Core 9:        +61.0°C  (high = +100.0°C, crit = +100.0°C)
Core 10:       +61.0°C  (high = +100.0°C, crit = +100.0°C)
Core 11:       +61.0°C  (high = +100.0°C, crit = +100.0°C)
Core 12:       +60.0°C  (high = +100.0°C, crit = +100.0°C)
Core 13:       +60.0°C  (high = +100.0°C, crit = +100.0°C)
Core 14:       +60.0°C  (high = +100.0°C, crit = +100.0°C)
Core 15:       +60.0°C  (high = +100.0°C, crit = +100.0°C)

thinkpad-isa-0000
Adapter: ISA adapter
fan1:        2199 RPM
CPU:          +60.0°C
GPU:              N/A
temp3:        +60.0°C
temp4:         +0.0°C
temp5:        +60.0°C
temp6:        +60.0°C
temp7:        +60.0°C
temp8:            N/A

ucsi_source_psy_USBC000:001-isa-0000
Adapter: ISA adapter
in0:           0.00 V  (min =  +0.00 V, max =  +0.00 V)
curr1:         0.00 A  (max =  +0.00 A)

BAT0-acpi-0
Adapter: ACPI interface
in0:          12.91 V
power1:        0.00 W

iwlwifi_1-virtual-0
Adapter: Virtual device
temp1:        +43.0°C

ucsi_source_psy_USBC000:002-isa-0000
Adapter: ISA adapter
in0:           0.00 V  (min =  +0.00 V, max =  +0.00 V)
curr1:         3.00 A  (max =  +0.00 A)

nvme-pci-0200
Adapter: PCI adapter
Composite:    +45.9°C  (low  = -273.1°C, high = +85.8°C)
                       (crit = +86.8°C)
Sensor 1:     +48.9°C  (low  = -273.1°C, high = +65261.8°C)
Sensor 2:     +45.9°C  (low  = -273.1°C, high = +65261.8°C)

acpitz-acpi-0
Adapter: ACPI interface
temp1:        +60.0°C

❯ ./sensors-open-metrics.py --printout
#HELP coretemp-isa-0000_Package_id_0_temp1_input coretemp-isa-0000 Package id 0 temp1_input
#TYPE coretemp-isa-0000_Package_id_0_temp1_input gauge
coretemp-isa-0000_Package_id_0_temp1_input: 66.0
#HELP coretemp-isa-0000_Package_id_0_temp1_max coretemp-isa-0000 Package id 0 temp1_max
#TYPE coretemp-isa-0000_Package_id_0_temp1_max gauge
coretemp-isa-0000_Package_id_0_temp1_max: 100.0
#HELP coretemp-isa-0000_Package_id_0_temp1_crit coretemp-isa-0000 Package id 0 temp1_crit
#TYPE coretemp-isa-0000_Package_id_0_temp1_crit gauge
coretemp-isa-0000_Package_id_0_temp1_crit: 100.0
#HELP coretemp-isa-0000_Package_id_0_temp1_crit_alarm coretemp-isa-0000 Package id 0 temp1_crit_alarm
#TYPE coretemp-isa-0000_Package_id_0_temp1_crit_alarm gauge
coretemp-isa-0000_Package_id_0_temp1_crit_alarm: 0.0
#HELP coretemp-isa-0000_Core_0_temp2_input coretemp-isa-0000 Core 0 temp2_input
#TYPE coretemp-isa-0000_Core_0_temp2_input gauge
coretemp-isa-0000_Core_0_temp2_input: 61.0
#HELP coretemp-isa-0000_Core_0_temp2_max coretemp-isa-0000 Core 0 temp2_max
#TYPE coretemp-isa-0000_Core_0_temp2_max gauge
coretemp-isa-0000_Core_0_temp2_max: 100.0
#HELP coretemp-isa-0000_Core_0_temp2_crit coretemp-isa-0000 Core 0 temp2_crit
#TYPE coretemp-isa-0000_Core_0_temp2_crit gauge
coretemp-isa-0000_Core_0_temp2_crit: 100.0
#HELP coretemp-isa-0000_Core_0_temp2_crit_alarm coretemp-isa-0000 Core 0 temp2_crit_alarm
#TYPE coretemp-isa-0000_Core_0_temp2_crit_alarm gauge
coretemp-isa-0000_Core_0_temp2_crit_alarm: 0.0
#HELP coretemp-isa-0000_Core_4_temp6_input coretemp-isa-0000 Core 4 temp6_input
#TYPE coretemp-isa-0000_Core_4_temp6_input gauge
coretemp-isa-0000_Core_4_temp6_input: 58.0
#HELP coretemp-isa-0000_Core_4_temp6_max coretemp-isa-0000 Core 4 temp6_max
#TYPE coretemp-isa-0000_Core_4_temp6_max gauge
coretemp-isa-0000_Core_4_temp6_max: 100.0
#HELP coretemp-isa-0000_Core_4_temp6_crit coretemp-isa-0000 Core 4 temp6_crit
#TYPE coretemp-isa-0000_Core_4_temp6_crit gauge
coretemp-isa-0000_Core_4_temp6_crit: 100.0
#HELP coretemp-isa-0000_Core_4_temp6_crit_alarm coretemp-isa-0000 Core 4 temp6_crit_alarm
#TYPE coretemp-isa-0000_Core_4_temp6_crit_alarm gauge
coretemp-isa-0000_Core_4_temp6_crit_alarm: 0.0
#HELP coretemp-isa-0000_Core_8_temp10_input coretemp-isa-0000 Core 8 temp10_input
#TYPE coretemp-isa-0000_Core_8_temp10_input gauge
coretemp-isa-0000_Core_8_temp10_input: 66.0
#HELP coretemp-isa-0000_Core_8_temp10_max coretemp-isa-0000 Core 8 temp10_max
#TYPE coretemp-isa-0000_Core_8_temp10_max gauge
coretemp-isa-0000_Core_8_temp10_max: 100.0
#HELP coretemp-isa-0000_Core_8_temp10_crit coretemp-isa-0000 Core 8 temp10_crit
#TYPE coretemp-isa-0000_Core_8_temp10_crit gauge
coretemp-isa-0000_Core_8_temp10_crit: 100.0
#HELP coretemp-isa-0000_Core_8_temp10_crit_alarm coretemp-isa-0000 Core 8 temp10_crit_alarm
#TYPE coretemp-isa-0000_Core_8_temp10_crit_alarm gauge
coretemp-isa-0000_Core_8_temp10_crit_alarm: 0.0
#HELP coretemp-isa-0000_Core_9_temp11_input coretemp-isa-0000 Core 9 temp11_input
#TYPE coretemp-isa-0000_Core_9_temp11_input gauge
coretemp-isa-0000_Core_9_temp11_input: 66.0
#HELP coretemp-isa-0000_Core_9_temp11_max coretemp-isa-0000 Core 9 temp11_max
#TYPE coretemp-isa-0000_Core_9_temp11_max gauge
coretemp-isa-0000_Core_9_temp11_max: 100.0
#HELP coretemp-isa-0000_Core_9_temp11_crit coretemp-isa-0000 Core 9 temp11_crit
#TYPE coretemp-isa-0000_Core_9_temp11_crit gauge
coretemp-isa-0000_Core_9_temp11_crit: 100.0
#HELP coretemp-isa-0000_Core_9_temp11_crit_alarm coretemp-isa-0000 Core 9 temp11_crit_alarm
#TYPE coretemp-isa-0000_Core_9_temp11_crit_alarm gauge
coretemp-isa-0000_Core_9_temp11_crit_alarm: 0.0
#HELP coretemp-isa-0000_Core_10_temp12_input coretemp-isa-0000 Core 10 temp12_input
#TYPE coretemp-isa-0000_Core_10_temp12_input gauge
coretemp-isa-0000_Core_10_temp12_input: 66.0
#HELP coretemp-isa-0000_Core_10_temp12_max coretemp-isa-0000 Core 10 temp12_max
#TYPE coretemp-isa-0000_Core_10_temp12_max gauge
coretemp-isa-0000_Core_10_temp12_max: 100.0
#HELP coretemp-isa-0000_Core_10_temp12_crit coretemp-isa-0000 Core 10 temp12_crit
#TYPE coretemp-isa-0000_Core_10_temp12_crit gauge
coretemp-isa-0000_Core_10_temp12_crit: 100.0
#HELP coretemp-isa-0000_Core_10_temp12_crit_alarm coretemp-isa-0000 Core 10 temp12_crit_alarm
#TYPE coretemp-isa-0000_Core_10_temp12_crit_alarm gauge
coretemp-isa-0000_Core_10_temp12_crit_alarm: 0.0
#HELP coretemp-isa-0000_Core_11_temp13_input coretemp-isa-0000 Core 11 temp13_input
#TYPE coretemp-isa-0000_Core_11_temp13_input gauge
coretemp-isa-0000_Core_11_temp13_input: 66.0
#HELP coretemp-isa-0000_Core_11_temp13_max coretemp-isa-0000 Core 11 temp13_max
#TYPE coretemp-isa-0000_Core_11_temp13_max gauge
coretemp-isa-0000_Core_11_temp13_max: 100.0
#HELP coretemp-isa-0000_Core_11_temp13_crit coretemp-isa-0000 Core 11 temp13_crit
#TYPE coretemp-isa-0000_Core_11_temp13_crit gauge
coretemp-isa-0000_Core_11_temp13_crit: 100.0
#HELP coretemp-isa-0000_Core_11_temp13_crit_alarm coretemp-isa-0000 Core 11 temp13_crit_alarm
#TYPE coretemp-isa-0000_Core_11_temp13_crit_alarm gauge
coretemp-isa-0000_Core_11_temp13_crit_alarm: 0.0
#HELP coretemp-isa-0000_Core_12_temp14_input coretemp-isa-0000 Core 12 temp14_input
#TYPE coretemp-isa-0000_Core_12_temp14_input gauge
coretemp-isa-0000_Core_12_temp14_input: 61.0
#HELP coretemp-isa-0000_Core_12_temp14_max coretemp-isa-0000 Core 12 temp14_max
#TYPE coretemp-isa-0000_Core_12_temp14_max gauge
coretemp-isa-0000_Core_12_temp14_max: 100.0
#HELP coretemp-isa-0000_Core_12_temp14_crit coretemp-isa-0000 Core 12 temp14_crit
#TYPE coretemp-isa-0000_Core_12_temp14_crit gauge
coretemp-isa-0000_Core_12_temp14_crit: 100.0
#HELP coretemp-isa-0000_Core_12_temp14_crit_alarm coretemp-isa-0000 Core 12 temp14_crit_alarm
#TYPE coretemp-isa-0000_Core_12_temp14_crit_alarm gauge
coretemp-isa-0000_Core_12_temp14_crit_alarm: 0.0
#HELP coretemp-isa-0000_Core_13_temp15_input coretemp-isa-0000 Core 13 temp15_input
#TYPE coretemp-isa-0000_Core_13_temp15_input gauge
coretemp-isa-0000_Core_13_temp15_input: 61.0
#HELP coretemp-isa-0000_Core_13_temp15_max coretemp-isa-0000 Core 13 temp15_max
#TYPE coretemp-isa-0000_Core_13_temp15_max gauge
coretemp-isa-0000_Core_13_temp15_max: 100.0
#HELP coretemp-isa-0000_Core_13_temp15_crit coretemp-isa-0000 Core 13 temp15_crit
#TYPE coretemp-isa-0000_Core_13_temp15_crit gauge
coretemp-isa-0000_Core_13_temp15_crit: 100.0
#HELP coretemp-isa-0000_Core_13_temp15_crit_alarm coretemp-isa-0000 Core 13 temp15_crit_alarm
#TYPE coretemp-isa-0000_Core_13_temp15_crit_alarm gauge
coretemp-isa-0000_Core_13_temp15_crit_alarm: 0.0
#HELP coretemp-isa-0000_Core_14_temp16_input coretemp-isa-0000 Core 14 temp16_input
#TYPE coretemp-isa-0000_Core_14_temp16_input gauge
coretemp-isa-0000_Core_14_temp16_input: 61.0
#HELP coretemp-isa-0000_Core_14_temp16_max coretemp-isa-0000 Core 14 temp16_max
#TYPE coretemp-isa-0000_Core_14_temp16_max gauge
coretemp-isa-0000_Core_14_temp16_max: 100.0
#HELP coretemp-isa-0000_Core_14_temp16_crit coretemp-isa-0000 Core 14 temp16_crit
#TYPE coretemp-isa-0000_Core_14_temp16_crit gauge
coretemp-isa-0000_Core_14_temp16_crit: 100.0
#HELP coretemp-isa-0000_Core_14_temp16_crit_alarm coretemp-isa-0000 Core 14 temp16_crit_alarm
#TYPE coretemp-isa-0000_Core_14_temp16_crit_alarm gauge
coretemp-isa-0000_Core_14_temp16_crit_alarm: 0.0
#HELP coretemp-isa-0000_Core_15_temp17_input coretemp-isa-0000 Core 15 temp17_input
#TYPE coretemp-isa-0000_Core_15_temp17_input gauge
coretemp-isa-0000_Core_15_temp17_input: 61.0
#HELP coretemp-isa-0000_Core_15_temp17_max coretemp-isa-0000 Core 15 temp17_max
#TYPE coretemp-isa-0000_Core_15_temp17_max gauge
coretemp-isa-0000_Core_15_temp17_max: 100.0
#HELP coretemp-isa-0000_Core_15_temp17_crit coretemp-isa-0000 Core 15 temp17_crit
#TYPE coretemp-isa-0000_Core_15_temp17_crit gauge
coretemp-isa-0000_Core_15_temp17_crit: 100.0
#HELP coretemp-isa-0000_Core_15_temp17_crit_alarm coretemp-isa-0000 Core 15 temp17_crit_alarm
#TYPE coretemp-isa-0000_Core_15_temp17_crit_alarm gauge
coretemp-isa-0000_Core_15_temp17_crit_alarm: 0.0
#HELP thinkpad-isa-0000_fan1_fan1_input thinkpad-isa-0000 fan1 fan1_input
#TYPE thinkpad-isa-0000_fan1_fan1_input gauge
thinkpad-isa-0000_fan1_fan1_input: 2191.0
#HELP thinkpad-isa-0000_CPU_temp1_input thinkpad-isa-0000 CPU temp1_input
#TYPE thinkpad-isa-0000_CPU_temp1_input gauge
thinkpad-isa-0000_CPU_temp1_input: 60.0
#HELP thinkpad-isa-0000_temp3_temp3_input thinkpad-isa-0000 temp3 temp3_input
#TYPE thinkpad-isa-0000_temp3_temp3_input gauge
thinkpad-isa-0000_temp3_temp3_input: 60.0
#HELP thinkpad-isa-0000_temp4_temp4_input thinkpad-isa-0000 temp4 temp4_input
#TYPE thinkpad-isa-0000_temp4_temp4_input gauge
thinkpad-isa-0000_temp4_temp4_input: 0.0
#HELP thinkpad-isa-0000_temp5_temp5_input thinkpad-isa-0000 temp5 temp5_input
#TYPE thinkpad-isa-0000_temp5_temp5_input gauge
thinkpad-isa-0000_temp5_temp5_input: 60.0
#HELP thinkpad-isa-0000_temp6_temp6_input thinkpad-isa-0000 temp6 temp6_input
#TYPE thinkpad-isa-0000_temp6_temp6_input gauge
thinkpad-isa-0000_temp6_temp6_input: 60.0
#HELP thinkpad-isa-0000_temp7_temp7_input thinkpad-isa-0000 temp7 temp7_input
#TYPE thinkpad-isa-0000_temp7_temp7_input gauge
thinkpad-isa-0000_temp7_temp7_input: 60.0
#HELP ucsi_source_psy_USBC000:001-isa-0000_in0_in0_input ucsi_source_psy_USBC000:001-isa-0000 in0 in0_input
#TYPE ucsi_source_psy_USBC000:001-isa-0000_in0_in0_input gauge
ucsi_source_psy_USBC000:001-isa-0000_in0_in0_input: 0.0
#HELP ucsi_source_psy_USBC000:001-isa-0000_in0_in0_min ucsi_source_psy_USBC000:001-isa-0000 in0 in0_min
#TYPE ucsi_source_psy_USBC000:001-isa-0000_in0_in0_min gauge
ucsi_source_psy_USBC000:001-isa-0000_in0_in0_min: 0.0
#HELP ucsi_source_psy_USBC000:001-isa-0000_in0_in0_max ucsi_source_psy_USBC000:001-isa-0000 in0 in0_max
#TYPE ucsi_source_psy_USBC000:001-isa-0000_in0_in0_max gauge
ucsi_source_psy_USBC000:001-isa-0000_in0_in0_max: 0.0
#HELP ucsi_source_psy_USBC000:001-isa-0000_curr1_curr1_input ucsi_source_psy_USBC000:001-isa-0000 curr1 curr1_input
#TYPE ucsi_source_psy_USBC000:001-isa-0000_curr1_curr1_input gauge
ucsi_source_psy_USBC000:001-isa-0000_curr1_curr1_input: 0.0
#HELP ucsi_source_psy_USBC000:001-isa-0000_curr1_curr1_max ucsi_source_psy_USBC000:001-isa-0000 curr1 curr1_max
#TYPE ucsi_source_psy_USBC000:001-isa-0000_curr1_curr1_max gauge
ucsi_source_psy_USBC000:001-isa-0000_curr1_curr1_max: 0.0
#HELP BAT0-acpi-0_in0_in0_input BAT0-acpi-0 in0 in0_input
#TYPE BAT0-acpi-0_in0_in0_input gauge
BAT0-acpi-0_in0_in0_input: 12.909
#HELP BAT0-acpi-0_power1_power1_input BAT0-acpi-0 power1 power1_input
#TYPE BAT0-acpi-0_power1_power1_input gauge
BAT0-acpi-0_power1_power1_input: 0.0
#HELP iwlwifi_1-virtual-0_temp1_temp1_input iwlwifi_1-virtual-0 temp1 temp1_input
#TYPE iwlwifi_1-virtual-0_temp1_temp1_input gauge
iwlwifi_1-virtual-0_temp1_temp1_input: 43.0
#HELP ucsi_source_psy_USBC000:002-isa-0000_in0_in0_input ucsi_source_psy_USBC000:002-isa-0000 in0 in0_input
#TYPE ucsi_source_psy_USBC000:002-isa-0000_in0_in0_input gauge
ucsi_source_psy_USBC000:002-isa-0000_in0_in0_input: 0.0
#HELP ucsi_source_psy_USBC000:002-isa-0000_in0_in0_min ucsi_source_psy_USBC000:002-isa-0000 in0 in0_min
#TYPE ucsi_source_psy_USBC000:002-isa-0000_in0_in0_min gauge
ucsi_source_psy_USBC000:002-isa-0000_in0_in0_min: 0.0
#HELP ucsi_source_psy_USBC000:002-isa-0000_in0_in0_max ucsi_source_psy_USBC000:002-isa-0000 in0 in0_max
#TYPE ucsi_source_psy_USBC000:002-isa-0000_in0_in0_max gauge
ucsi_source_psy_USBC000:002-isa-0000_in0_in0_max: 0.0
#HELP ucsi_source_psy_USBC000:002-isa-0000_curr1_curr1_input ucsi_source_psy_USBC000:002-isa-0000 curr1 curr1_input
#TYPE ucsi_source_psy_USBC000:002-isa-0000_curr1_curr1_input gauge
ucsi_source_psy_USBC000:002-isa-0000_curr1_curr1_input: 3.0
#HELP ucsi_source_psy_USBC000:002-isa-0000_curr1_curr1_max ucsi_source_psy_USBC000:002-isa-0000 curr1 curr1_max
#TYPE ucsi_source_psy_USBC000:002-isa-0000_curr1_curr1_max gauge
ucsi_source_psy_USBC000:002-isa-0000_curr1_curr1_max: 0.0
#HELP nvme-pci-0200_Composite_temp1_input nvme-pci-0200 Composite temp1_input
#TYPE nvme-pci-0200_Composite_temp1_input gauge
nvme-pci-0200_Composite_temp1_input: 45.85
#HELP nvme-pci-0200_Composite_temp1_max nvme-pci-0200 Composite temp1_max
#TYPE nvme-pci-0200_Composite_temp1_max gauge
nvme-pci-0200_Composite_temp1_max: 85.85
#HELP nvme-pci-0200_Composite_temp1_min nvme-pci-0200 Composite temp1_min
#TYPE nvme-pci-0200_Composite_temp1_min gauge
nvme-pci-0200_Composite_temp1_min: -273.15
#HELP nvme-pci-0200_Composite_temp1_crit nvme-pci-0200 Composite temp1_crit
#TYPE nvme-pci-0200_Composite_temp1_crit gauge
nvme-pci-0200_Composite_temp1_crit: 86.85
#HELP nvme-pci-0200_Composite_temp1_alarm nvme-pci-0200 Composite temp1_alarm
#TYPE nvme-pci-0200_Composite_temp1_alarm gauge
nvme-pci-0200_Composite_temp1_alarm: 0.0
#HELP nvme-pci-0200_Sensor_1_temp2_input nvme-pci-0200 Sensor 1 temp2_input
#TYPE nvme-pci-0200_Sensor_1_temp2_input gauge
nvme-pci-0200_Sensor_1_temp2_input: 50.85
#HELP nvme-pci-0200_Sensor_1_temp2_max nvme-pci-0200 Sensor 1 temp2_max
#TYPE nvme-pci-0200_Sensor_1_temp2_max gauge
nvme-pci-0200_Sensor_1_temp2_max: 65261.85
#HELP nvme-pci-0200_Sensor_1_temp2_min nvme-pci-0200 Sensor 1 temp2_min
#TYPE nvme-pci-0200_Sensor_1_temp2_min gauge
nvme-pci-0200_Sensor_1_temp2_min: -273.15
#HELP nvme-pci-0200_Sensor_2_temp3_input nvme-pci-0200 Sensor 2 temp3_input
#TYPE nvme-pci-0200_Sensor_2_temp3_input gauge
nvme-pci-0200_Sensor_2_temp3_input: 45.85
#HELP nvme-pci-0200_Sensor_2_temp3_max nvme-pci-0200 Sensor 2 temp3_max
#TYPE nvme-pci-0200_Sensor_2_temp3_max gauge
nvme-pci-0200_Sensor_2_temp3_max: 65261.85
#HELP nvme-pci-0200_Sensor_2_temp3_min nvme-pci-0200 Sensor 2 temp3_min
#TYPE nvme-pci-0200_Sensor_2_temp3_min gauge
nvme-pci-0200_Sensor_2_temp3_min: -273.15
#HELP acpitz-acpi-0_temp1_temp1_input acpitz-acpi-0 temp1 temp1_input
#TYPE acpitz-acpi-0_temp1_temp1_input gauge
acpitz-acpi-0_temp1_temp1_input: 60.0
Os dados aparecem no #HELP simplesmente sem os _.
Talvez eu devesse melhorar e fazer com que alguns valores fosse labels do valor maior.
Mas por enquanto está funcionando assim.
E pra rodar como serviço:
❯ ./sensors-open-metrics.py
[2025-12-12 19:54:43] (INFO) starting service on port 9090
INFO:     Started server process [1078630]
INFO:     Waiting for application startup.
INFO:     Application startup complete.
INFO:     Uvicorn running on http://127.0.0.1:9090 (Press CTRL+C to quit)
[2025-12-12 19:54:53] (INFO) serving web page on /metrics
INFO:     127.0.0.1:52250 - "GET /metrics HTTP/1.1" 200 OK
Em outro terminal:
  ❯ curl localhost:9090/metrics
#HELP coretemp-isa-0000_Package_id_0_temp1_input coretemp-isa-0000 Package id 0 temp1_input
#TYPE coretemp-isa-0000_Package_id_0_temp1_input gauge
coretemp-isa-0000_Package_id_0_temp1_input: 62.0
#HELP coretemp-isa-0000_Package_id_0_temp1_max coretemp-isa-0000 Package id 0 temp1_max
#TYPE coretemp-isa-0000_Package_id_0_temp1_max gauge
coretemp-isa-0000_Package_id_0_temp1_max: 100.0
#HELP coretemp-isa-0000_Package_id_0_temp1_crit coretemp-isa-0000 Package id 0 temp1_crit
#TYPE coretemp-isa-0000_Package_id_0_temp1_crit gauge
coretemp-isa-0000_Package_id_0_temp1_crit: 100.0
#HELP coretemp-isa-0000_Package_id_0_temp1_crit_alarm coretemp-isa-0000 Package id 0 temp1_crit_alarm
[...]
Pra rodar como serviço do systemd em /etc/systemd/system/sensors-open-metrics.service:
[Unit]
Description=Temperature sensors
Wants=network-online.target
After=network-online.target nginx.service

[Service]
Restart=always
User=root
Group=root
WorkingDirectory=/tmp
ExecStart=/usr/local/bin/sensors-open-metrics.py
TimeoutStopSec=5s

[Install]
WantedBy=multi-user.target
E finalmente adicionando em /etc/alloy/config.alloy:
[...]
    discovery.relabel "temperature_metrics" {
        targets = array.concat(
                [{
                        __address__ = "localhost:9090",
                }],
        )

        rule {
                source_labels = ["__address__"]
                target_label  = "instance"
                replacement   = "nome_do_servidor"
        }
}

prometheus.scrape "temperature_metrics" {
        targets    = discovery.relabel.temperature_metrics.output
        forward_to = [prometheus.remote_write.prod.receiver]
        job_name   = "temperature"
}
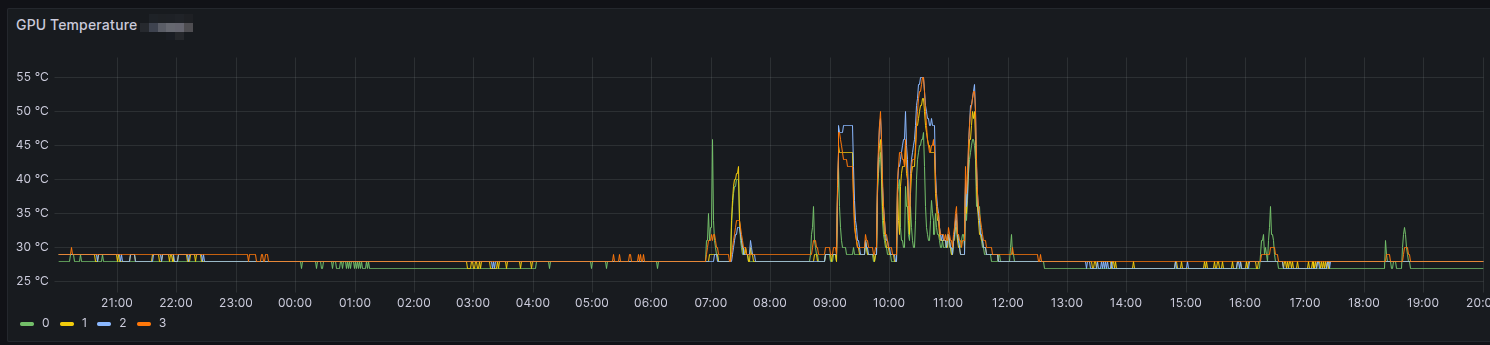
Daí é só evocar o Grafana e partir por gráficos.
Update: atualizado em
Sat Dec 13 02:43:59 PM CET 2025
com mais informação sobre a parte de script.