Com tudo rodando redondo na minha bolha, bolha minha, resta melhorar a resiliência com backups. Até agora apostei no zfs como saída pra qualquer problema. Mas isso é jogar com a sorte.
Fiz um pequeno e simples script de backup que executa dentro do container, que roda via podman, e faz o pg_dumpall do postgres.
#! /usr/bin/env bash
#
#pg_dumpall -U $POSTGRES_USER -f full-backup-$(date "+%Y-%m-%dT%H:%M:%S").sql
#
RETENTION=12

timestamp=$(date "+%Y-%m-%dT%H:%M:%S")
current_dir=$(readlink -f $0)
current_dir=$(dirname $current_dir)
program=$0
program=$(basename $program)
backup_file="full-backup-$timestamp.sql"


echo "Backup on: $timestamp"

podman exec postgres \
        bash -c "pg_dumpall -U \$POSTGRES_USER -f /var/lib/postgresql/backup/$backup_file"

bzip2 $current_dir/postgresql/backup/$backup_file

for filename in $(find $current_dir/postgresql/backup -print | grep bz2 | sort | sed "1,${RETENTION}d")
do
        echo "Removing: $filename"
        rm -f $filename
done
E coloquei RETENTION=12 pra manter os últimos 12 backups.
Mas por quê 12?
Sei lá.
Pareceu um número legal.
Eu poderia rodar tudo via crontab, como geralmente faço. Mas nesse caso eu resolvi fazer com timer do systemd. Então primeiro criei o serviço de backup e depois o timer que ativa esse serviço.
❯ systemctl --user --force --full edit gotosocial-backup.service
❯ systemctl --user --force --full edit gotosocial-backup.timer
Assim são criados o serviço e o timer em modo usuário.
O gotosocial-backup.service:
[Unit]
Wants=gotosocial.service
After=gotosocial.service

[Service]
Type=oneshot
ExecStart=/home/helio/gotosocial/run-backup.sh
WorkingDirectory=/home/helio/gotosocial

[Install]
WantedBy=default.target
O gotosocial-backup.timer:
[Unit]
Description=GoToSo daily backup

[Timer]
OnCalendar=daily
Persistent=true

[Install]
WantedBy=timers.target
Após serem criados, eles ficam em seu diretório de usuário:
/home/helio/.config/systemd/user/gotosocial-backup.{service,timer}
Daí é só habilitar ambos. Ao fazer isso, um backup será gerado pois o systemd vai rodar o serviço ao ser ativado.
❯ systemctl enable --now --user gotosocial-backup.service
❯ systemctl enable --now --user gotosocial-backup.timer
Claro que ainda não testei restaurar nenhum desses backups.
Vou deixar pra fazer isso quando tiver algum problema de verdade.
No momento eles estão salvos em /home/helio/gotosocial/postgresql/backup
que é onde apontei como volume dentro compose.yaml do podman.
❯ ls -1 /home/helio/gotosocial/postgresql/backup/
full-backup-2025-11-29T13:17:38.sql.bz2
full-backup-2025-11-29T13:46:32.sql.bz2
full-backup-2025-11-29T13:47:14.sql.bz2
E também não testei meu "retention". Daqui 9 dias eu conto se deu certo.
Numa discussão no fediverso falamos sobre habilitar as métricas do GoToSo, também conhecido como GoToSocial. Fiz algumas mudanças e consegui expor essas métricas.
O compose.yaml do GoToSo:
services:
  gotosocial:
    image: docker.io/superseriousbusiness/gotosocial:latest
    container_name: gotosocial
    user: 1000:1000
    networks:
      - gotosocial
    environment:
      GTS_HOST: bolha.linux-br.org
      GTS_DB_TYPE: postgres
      GTS_CONFIG_PATH: /gotosocial/config.yaml
      [...]
      OTEL_METRICS_PRODUCERS: prometheus
      OTEL_METRICS_EXPORTER: prometheus
      OTEL_EXPORTER_PROMETHEUS_HOST: 0.0.0.0
      OTEL_EXPORTER_PROMETHEUS_PORT: 9090
      [...]
    ports:
      - "8080:8080"
      - "9090:9090"
    [...]
A config.yaml também do GoToSo:
[...]
media-emoji-local-max-size: 250KiB
media-emoji-remote-max-size: 250KiB
advanced-rate-limit-requests: 0
metrics-enabled: true
Uma vez que isso estava habilitado e o container reiniciado, foi só verificar a porta 9090.
❯ curl -s localhost:9090/metrics | head -10
# HELP go_config_gogc_percent Heap size target percentage configured by the user, otherwise 100.
# TYPE go_config_gogc_percent gauge
go_config_gogc_percent{otel_scope_name="go.opentelemetry.io/contrib/instrumentation/runtime",otel_scope_schema_url="",otel_scope_version="0.63.0"} 100
# HELP go_goroutine_count Count of live goroutines.
# TYPE go_goroutine_count gauge
go_goroutine_count{otel_scope_name="go.opentelemetry.io/contrib/instrumentation/runtime",otel_scope_schema_url="",otel_scope_version="0.63.0"} 167
# HELP go_memory_allocated_bytes_total Memory allocated to the heap by the application.
# TYPE go_memory_allocated_bytes_total counter
go_memory_allocated_bytes_total{otel_scope_name="go.opentelemetry.io/contrib/instrumentation/runtime",otel_scope_schema_url="",otel_scope_version="0.63.0"} 1.6433066284e+11
# HELP go_memory_allocations_total Count of allocations to the heap by the application.
Em seguida subi um container, também com podman, pra coletar esses dados. Junto com um prometheus-exporter pra coletar dados da máquina.
compose.yaml:
services:
  prometheus:
    image: quay.io/prometheus/prometheus
    container_name: prometheus
    environment:
      TZ: Europe/Stockholm
    ports:
      - "9000:9090"
    volumes:
      - data:/prometheus
      - ./prometheus.yml:/etc/prometheus/prometheus.yml:ro
    restart: unless-stopped
    extra_hosts:
      - localserver:192.168.1.2

volumes:
  data:
prometheus.yml:
global:
  scrape_interval: 15s
  evaluation_interval: 15s

scrape_configs:
  - job_name: "prometheus"
    static_configs:
      - targets:
        - "localhost:9090"
        labels:
          app: "prometheus"

  - job_name: "mimir"
    static_configs:
      - targets:
        - "localserver:9100"
        labels:
          app: "mimir"

  - job_name: "gotoso"
    static_configs:
      - targets:
        - "localserver:9090"
        labels:
          app: "gotoso"
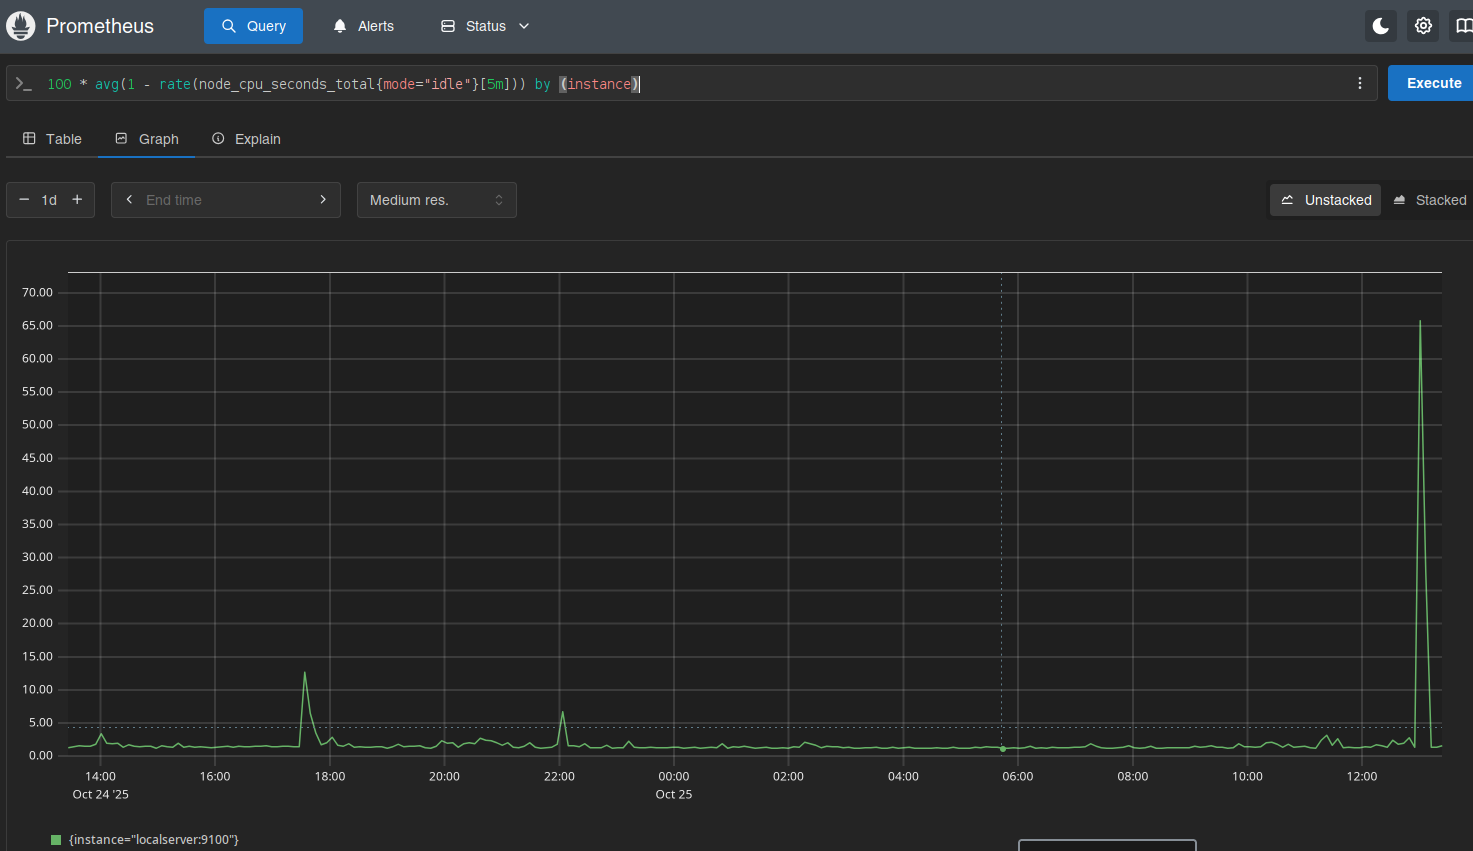
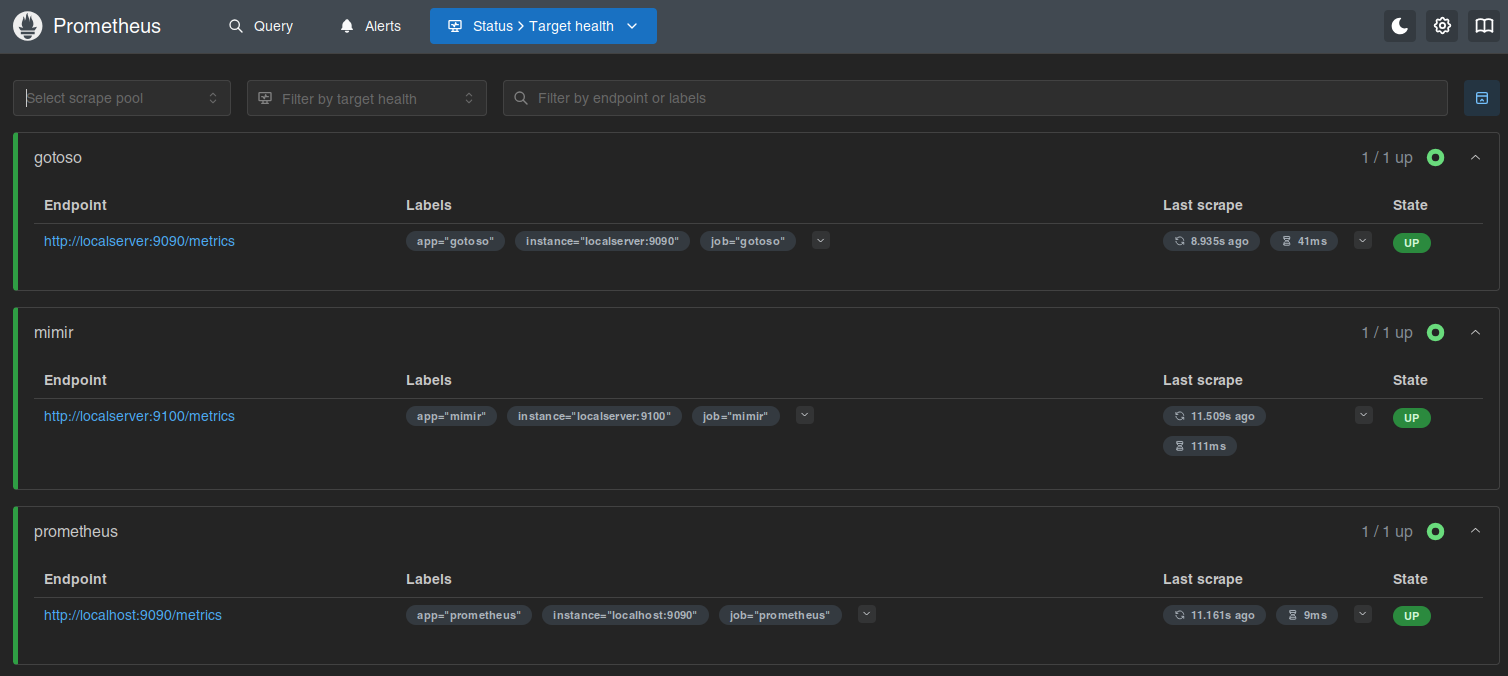
Isso já faz subir e você pode olhar no target health.
Daí é deixar o Prometheus coletar os dados e depois olhar os gráficos.

Ninguém me segurou, mas também não instalei o Grafana.
Por enquanto...